- Subscribe to RSS Feed
- Mark as New
- Mark as Read
- Bookmark
- Subscribe
- Printer Friendly Page
- Report Inappropriate Content
Dashboard for Top Requested DNS Name Count by Client
Dashboard for Top Requested DNS Name Count by Client
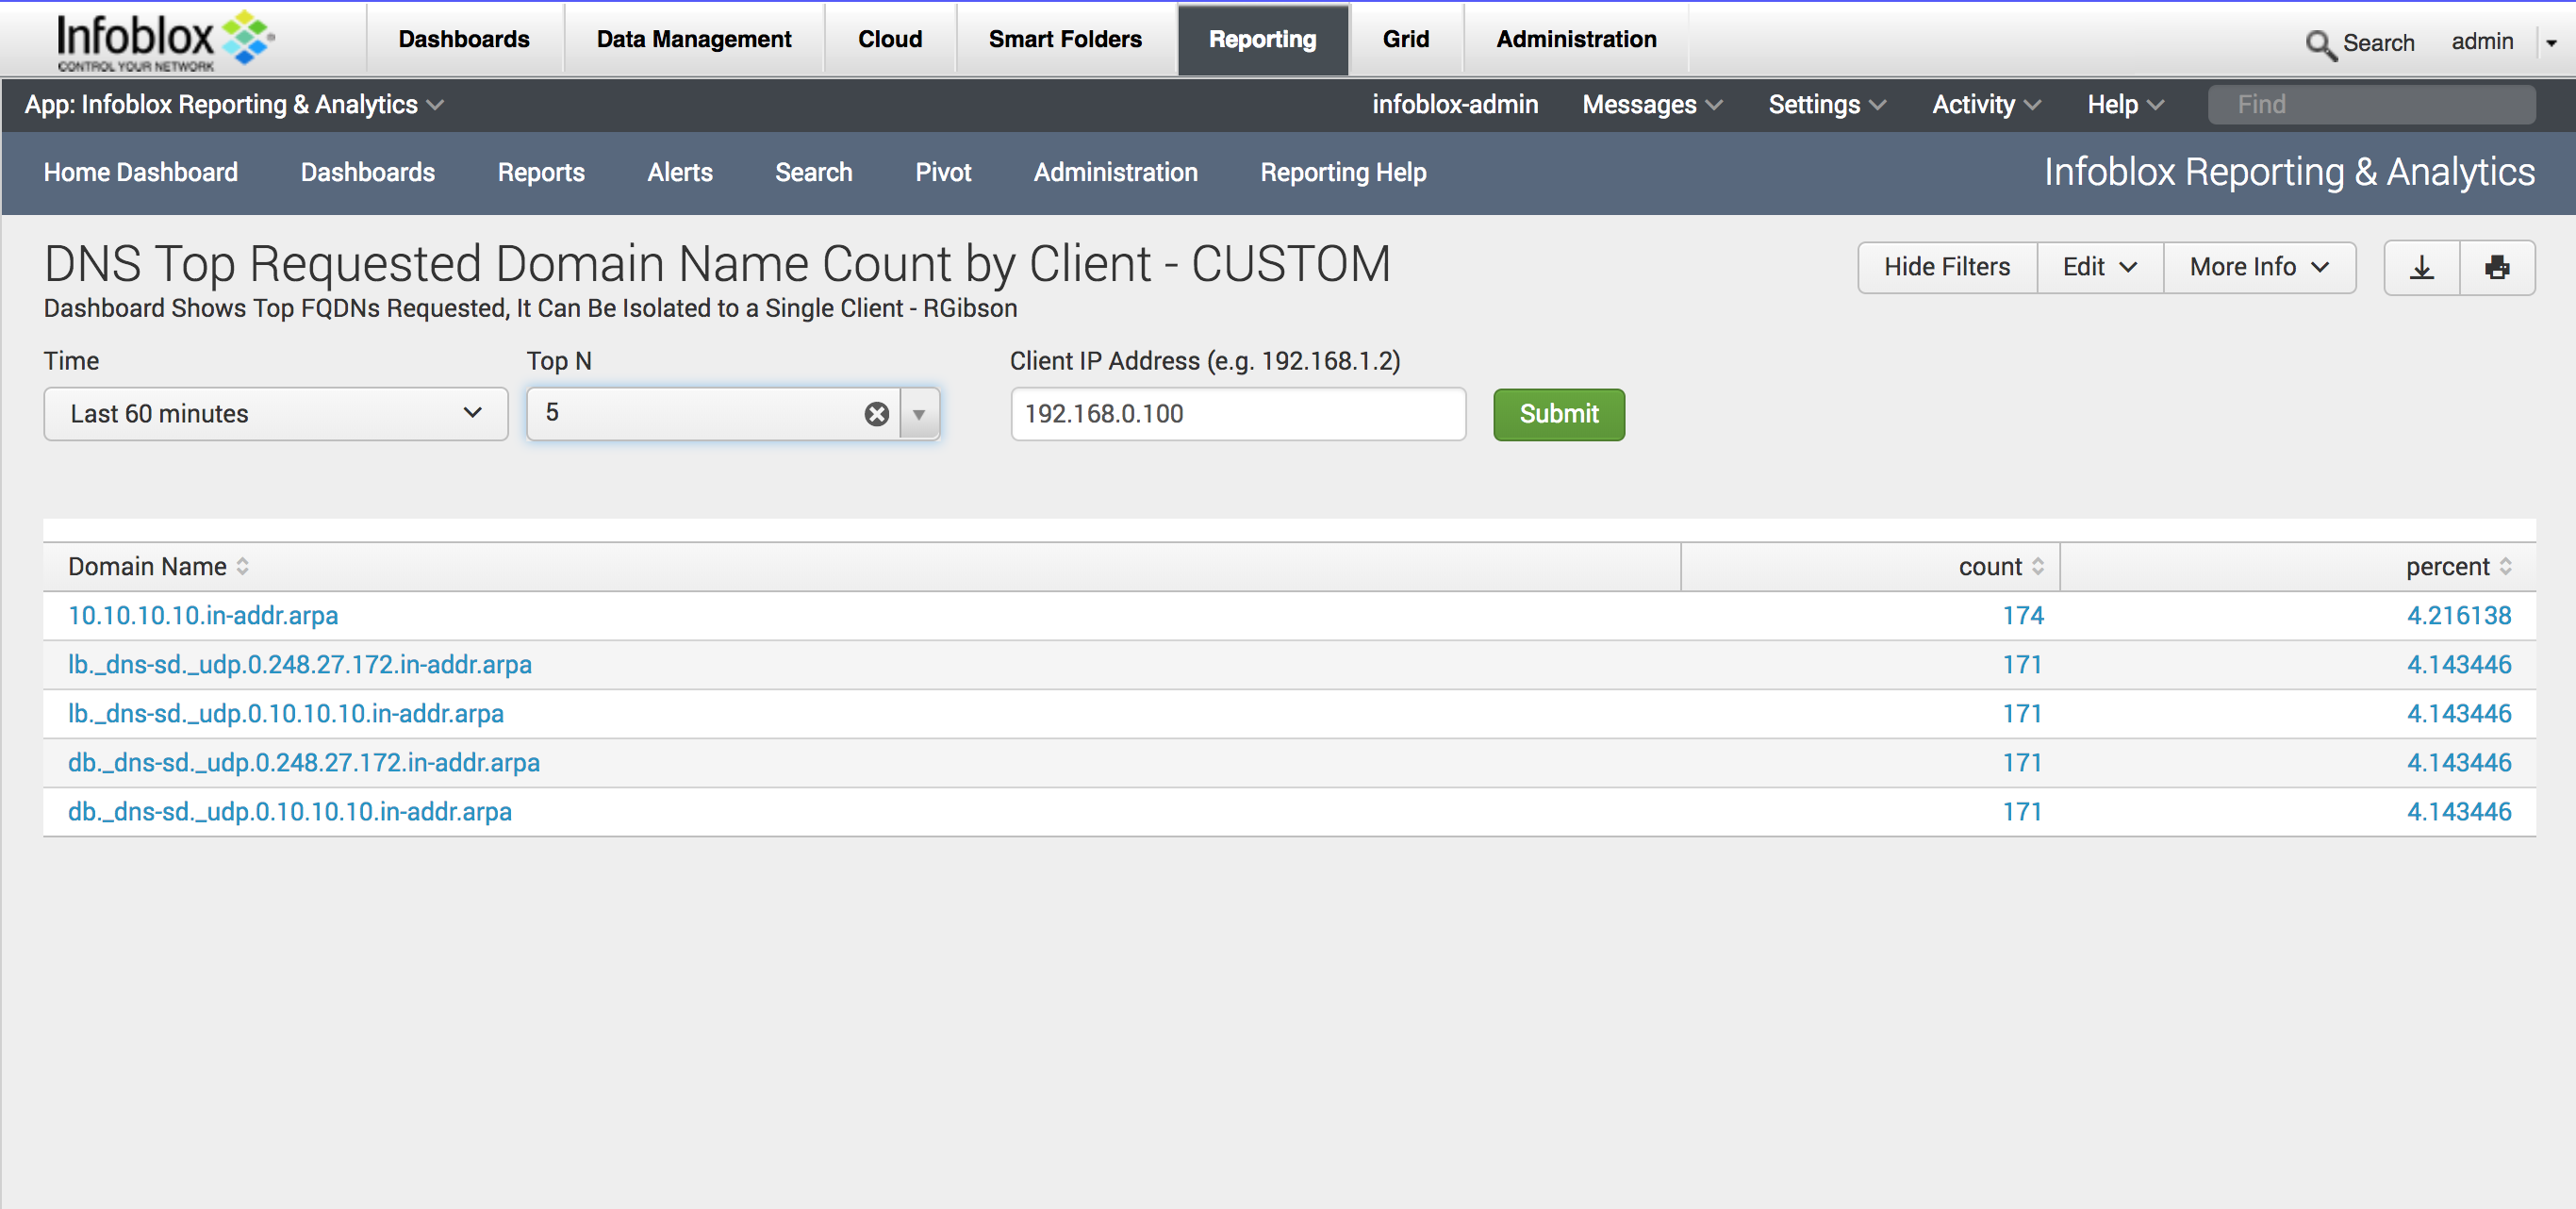
I created a dashboard that I'm hoping some others will find useful. The dashboard allows the user to get a more consolidated view of the client query data that is provided by the Data Connector. Rather than a mere list of all queries, this Dashboard provides a top N count of requested names for a client, including a count of the requests. The source for the dashboard is below the example image:
<form>
<label>DNS Top Requested Domain Name Count by Client - CUSTOM</label>
<description>Dashboard Shows Top FQDNs Requested, It Can Be Isolated to a Single Client - RGibson</description>
<fieldset submitButton="true" autoRun="true">
<input type="time" token="time" searchWhenChanged="true">
<label>Time</label>
<default>
<earliest>-60m@m</earliest>
<latest>now</latest>
</default>
</input>
<input type="dropdown" token="topn" searchWhenChanged="true">
<label>Top N</label>
<choice value="5">5</choice>
<choice value="10">10</choice>
<choice value="20">20</choice>
<choice value="50">50</choice>
<choice value="100">100</choice>
<choice value="200">200</choice>
<choice value="250">250</choice>
<choice value="500">500</choice>
<default>10</default>
</input>
<input type="text" token="client_ip" searchWhenChanged="true">
<label>Client IP Address (e.g. 192.168.1.2)</label>
<default>*</default>
</input>
</fieldset>
<search id="base_search">
<query>index=ib_dns_summary report=si_dns_requested_domain
$members$
$fqdn_str$
$dns_view_str$
| stats sum(COUNT) as FQDN_TOTAL by FQDN
| sort -FQDN_TOTAL
| head $topn$
| eventstats sum(FQDN_TOTAL) as TOTAL
| eval PERCENT=round(FQDN_TOTAL*100/TOTAL, 1)
| eval PHOST=FQDN+" ("+PERCENT+"%)"
| rename FQDN_TOTAL as Count, PHOST as "Domain Name"
| fields "Domain Name", Count</query>
<earliest>$time.earliest$</earliest>
<latest>$time.latest$</latest>
</search>
<row>
<panel>
<table>
<search>
<query>sourcetype=ib:dns:capture index=ib_dns_capture $client_ip$ | top $topn$ query | rename src_ip as "Source IP Address", query as "Domain Name", query_type as "Query Type", host as "Member"</query>
<earliest>$time.earliest$</earliest>
<latest>$time.latest$</latest>
</search>
<option name="wrap">true</option>
<option name="rowNumbers">false</option>
<option name="dataOverlayMode">none</option>
<option name="drilldown">cell</option>
<option name="count">10</option>
</table>
</panel>
</row>
</form>

