- Subscribe to RSS Feed
- Mark Topic as New
- Mark Topic as Read
- Float this Topic for Current User
- Bookmark
- Subscribe
- Printer Friendly Page
DNS Client Query Analysis Dashboard
[ Edited ]- Mark as New
- Bookmark
- Subscribe
- Subscribe to RSS Feed
- Permalink
- Report Inappropriate Content
11-24-2021 07:23 AM - edited 11-24-2021 08:58 AM
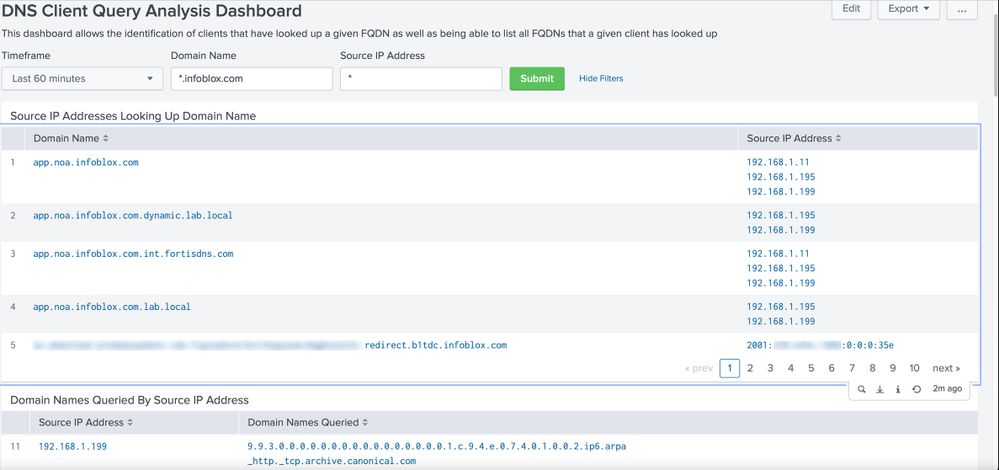
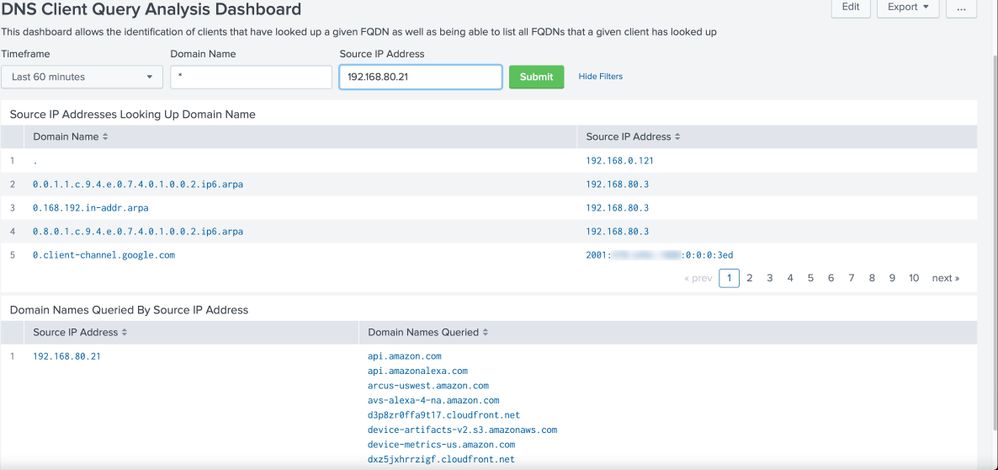
Attached is the XML code necessary to produce the DNS Client Query Analysis Dashboard within the Infoblox Reporting & Analytics solution. The purpose of this dashboard is to answer two basic questions often asked in a security context:
1. What clients have queried a given FQDN?
2. What FQDNs has a given source IP looked up?
Both of those questions can be answered quickly using this dashboard. The top half of the dashboard provides a view of source IP addresses listed by queried FQDN. The bottom half provides a view of all FQDNs queried in the requested timeframe listed by source IP. Below are some screenshots showing searches for a domain name, and for a specific source IP. It should be noted that the domain name search only applies to the top half of the dashboard, and the source IP search only applies to the bottom half of the dashboard, allowing the two to be filtered independently.
REQUIREMENT: This dashboard requires that you are using the Infoblox Data Connector in conjunction with NIOS query capture and that you are forwarding the query capture data in to the Reporting Member.
INSTALLATION: To install and run this dashboard:
- Click Reporting -> Dashboards -> Create New Dashboard
- Enter a temporary value for Title (this will be overwritten in a subsequent step) -> click Create Dashboard
- Click Source or Edit Source (depending on the NIOS version you are running)
- Copy the entire contents of the XML attached and completely replace the XML source of the newly created Dashboard
- Optionally change the value of the <label> and <description> tags at the top of the XML. By default the Dashboard will be called "DNS Client Query Analysis Dashboard".
- Click Save


Re: DNS Client Query Analysis Dashboard
- Mark as New
- Bookmark
- Subscribe
- Subscribe to RSS Feed
- Permalink
- Report Inappropriate Content
06-22-2023 10:30 AM
I followed your article step by step but even for google.com I have No result found.
I tried few other built in reports and non of them shows any data. Only search comes with any result. Any idea what is wrongly configured?
Thanks,
A.
Re: DNS Client Query Analysis Dashboard
- Mark as New
- Bookmark
- Subscribe
- Subscribe to RSS Feed
- Permalink
- Report Inappropriate Content
06-22-2023 10:57 AM
If you are not seeing data in this report, I would first ask whether or not you have enabled query capture to a Cloud Data Connector that is configured to send the query capture data to your reporting server. You mentioned missing data in other reports, which could mean that you don't have the indexing set up properly in your Grid reporting properties or that the reporting service isn't running on members that would produce the data.
Re: DNS Client Query Analysis Dashboard
- Mark as New
- Bookmark
- Subscribe
- Subscribe to RSS Feed
- Permalink
- Report Inappropriate Content
09-14-2023 10:32 AM
In my case the ib:dns:capture has the last update in 5/27/19 11:18:30.000 PM. Looks like that something change in this date.
Re: DNS Client Query Analysis Dashboard
- Mark as New
- Bookmark
- Subscribe
- Subscribe to RSS Feed
- Permalink
- Report Inappropriate Content
09-14-2023 01:31 PM
Is query capture enabled and is the CDC configured to send it to the reporting member? If not, that is your issue.
Re: DNS Client Query Analysis Dashboard
- Mark as New
- Bookmark
- Subscribe
- Subscribe to RSS Feed
- Permalink
- Report Inappropriate Content
06-18-2024 07:34 AM
Hi Ross,
Still working for you without changing the fields src_ip and query? For me that fields had being changed. I'm using 9.0 NIOS version.
Re: DNS Client Query Analysis Dashboard
- Mark as New
- Bookmark
- Subscribe
- Subscribe to RSS Feed
- Permalink
- Report Inappropriate Content
06-21-2024 01:47 PM
Leticia,
I haven't tried it in a grid running NIOS 9 yet. I'd love to know what you found that changed between 8.6 and 9 that required intervention.
Re: DNS Client Query Analysis Dashboard
[ Edited ]- Mark as New
- Bookmark
- Subscribe
- Subscribe to RSS Feed
- Permalink
- Report Inappropriate Content
09-19-2024 07:25 AM - edited 09-19-2024 07:26 AM
Ross,
This looks very promising and exactly what I'm looking for in my Infoblox reporting setup. However, I don't get any data visible. You say a requirement is the Infoblox Data Connector to be setup, but I can't find any information in the Infoblox docs about this, only some (for me) unrelated BloxOne configuration but I have an 100% on premise solution (running 8.6).
I have Infoblox Reporting service up and running, with report categories: 'DNS Query' + 'DNS Query Capture' enabled. Do I need to enable 'Capture DNS Queries', DNSTAP, Query logging or something else on the DNS members? How do I make sure it's send to the Reporting appliance and not overwhelming the Infoblox members.
Can you point me in the right direction how to set this up?
Re: DNS Client Query Analysis Dashboard
- Mark as New
- Bookmark
- Subscribe
- Subscribe to RSS Feed
- Permalink
- Report Inappropriate Content
09-19-2024 07:49 AM
In order to get that dashboard to work you must be performing query capture and using the data connector to feed it into the reporting server. The method for that when this originally was written was the "data connector", but it is now called the "cloud data connector (CDC)", which is deployed and managed from the Infoblox Platform (a/k/a BloxOne). Without the query capture configured leveraging the CDC, the dashboard will not have any data. Unfortunately, there is no way currently to do this 100% on-premises, the CDC is cloud managed, although once the data flow is set up in the platform there isn't any care and feeding.
I will also note that in a busy environment, sending that query capture data to the reporting server can consume a tremendous amount of indexing capacity (approx. 8 GB per day for every 1000 QPS, if you are doing query and response double that). So that should be considered versus your reporting license before enabling query capture.
Re: DNS Client Query Analysis Dashboard
- Mark as New
- Bookmark
- Subscribe
- Subscribe to RSS Feed
- Permalink
- Report Inappropriate Content
09-19-2024 09:44 AM
Thank you for your quick response! I understand it was from a different time and we now have no way to keep it on-premises.
I'm looking for a way to get insight in which devices send queries for a specific DNS zone. So in total the system gets around 5k qps, but a small amount of that is for a specific old zone that we are trying to empty but currently don't know which records are still queried by which devices. Your dashboard would give a very easy way of finding these devices, filter on the zone and see which devices pop up.
We had a look at DNSTAP but we don't run Advanced DNS Protection or DNS Cache Acceleration.
It looks like the only option left is using 'old school' query log send over syslog to e.g. Graylog.
I don't mean to hijack your thread on the dashboard, but do you see any other options than CDC or DNS query log to Graylog for detailed query information?
Re: DNS Client Query Analysis Dashboard
- Mark as New
- Bookmark
- Subscribe
- Subscribe to RSS Feed
- Permalink
- Report Inappropriate Content
09-20-2024 12:43 PM
For that use case (finding queriers of a given domain), if I were not already using the query capture function in the Grid, I would use query capture filtered only to the domain in question (via "LIMIT CAPTURE TO THESE DOMAINS" function) and dump it via SCP to a server where I could then review the files to determine who the clients are.
Re: DNS Client Query Analysis Dashboard
- Mark as New
- Bookmark
- Subscribe
- Subscribe to RSS Feed
- Permalink
- Report Inappropriate Content
09-24-2024 05:17 AM
Thanks Ross, that's exactly what I was testing over the weekend and it works great for us. For any long term monitoring I would definitely recommend the cloud data connector combined with your dashboard in reporter.
