- Subscribe to RSS Feed
- Mark Topic as New
- Mark Topic as Read
- Float this Topic for Current User
- Bookmark
- Subscribe
- Printer Friendly Page
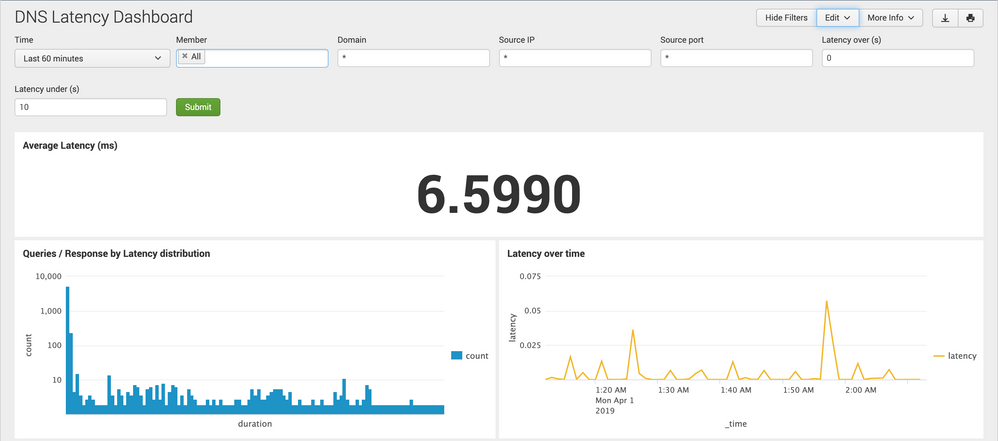
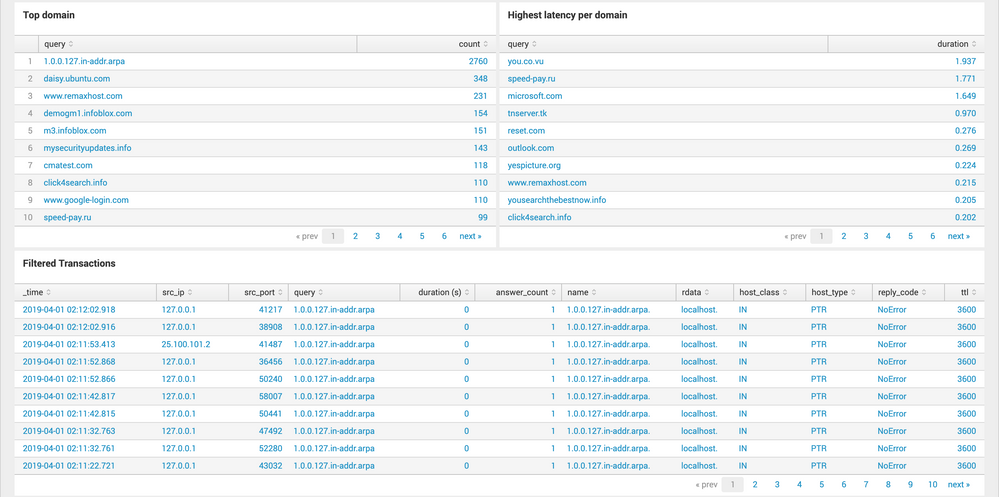
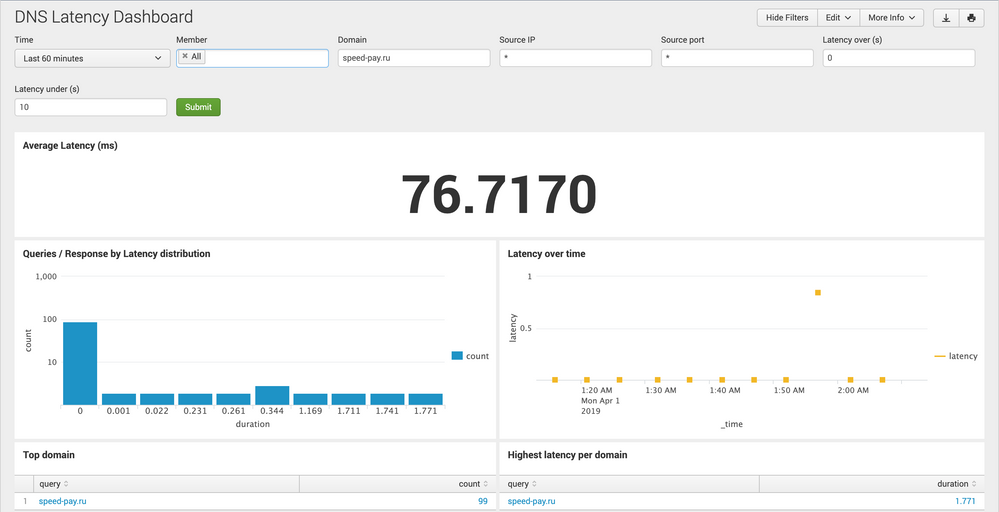
DNS Latency Dashboard
[ Edited ]- Mark as New
- Bookmark
- Subscribe
- Subscribe to RSS Feed
- Permalink
- Report Inappropriate Content
04-01-2019 02:19 AM - edited 04-01-2019 02:22 AM
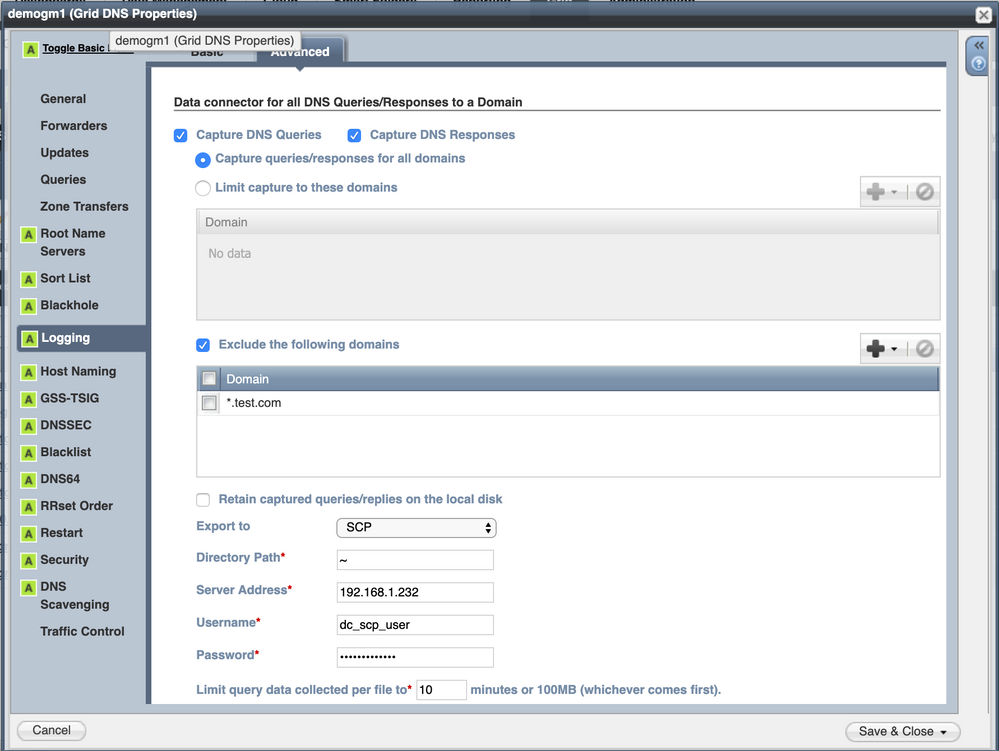
Prerequisite is to have both queries and response capture enabled
Nicolas

Re: DNS Latency Dashboard
- Mark as New
- Bookmark
- Subscribe
- Subscribe to RSS Feed
- Permalink
- Report Inappropriate Content
04-04-2019 04:16 PM
Recursive resolution performance - AWESOME!
The predefined ones are based on dnsperf and queries to 1.0.0.127.in-addr.arpa which makes it only useful for authoritative monitoring.
Re: DNS Latency Dashboard
- Mark as New
- Bookmark
- Subscribe
- Subscribe to RSS Feed
- Permalink
- Report Inappropriate Content
04-05-2019 09:10 AM
This is a great solution if you can afford the $$$ to up your reporter to the size needed to do query logging. Have you looked at creating some summary jobs so that it could be used for long term trending or anomly detection? I'm guessing that Splunk would have some issues with running the dashboard on a 20,000+ QPS grid over a week timeframe. But having access quickly to the domains driving the longer recursive queries would be of great value in troubleshooting issues. We still use the SNMP recursive latancy data that already exists by my round about syslog injection of the data into the reporting tool. It of course doesn't have this level of detal.
Re: DNS Latency Dashboard
- Mark as New
- Bookmark
- Subscribe
- Subscribe to RSS Feed
- Permalink
- Report Inappropriate Content
04-09-2019 12:49 AM
Hello DEvans,
there is two question here;
- cost related, summary indexes work on data that have already been indexed and then does not lower the license usage
- performance related, it is absolutely possible to have every hour a summary index updated with summarized data for all queries over 100ms latency
Regards
Nicolas
Re: DNS Latency Dashboard
- Mark as New
- Bookmark
- Subscribe
- Subscribe to RSS Feed
- Permalink
- Report Inappropriate Content
05-03-2019 12:46 PM
The syslog feed had to be turned off on our reporter because we only have the the 20 GB a day license. That is the problem.
Re: DNS Latency Dashboard
- Mark as New
- Bookmark
- Subscribe
- Subscribe to RSS Feed
- Permalink
- Report Inappropriate Content
05-03-2019 12:53 PM
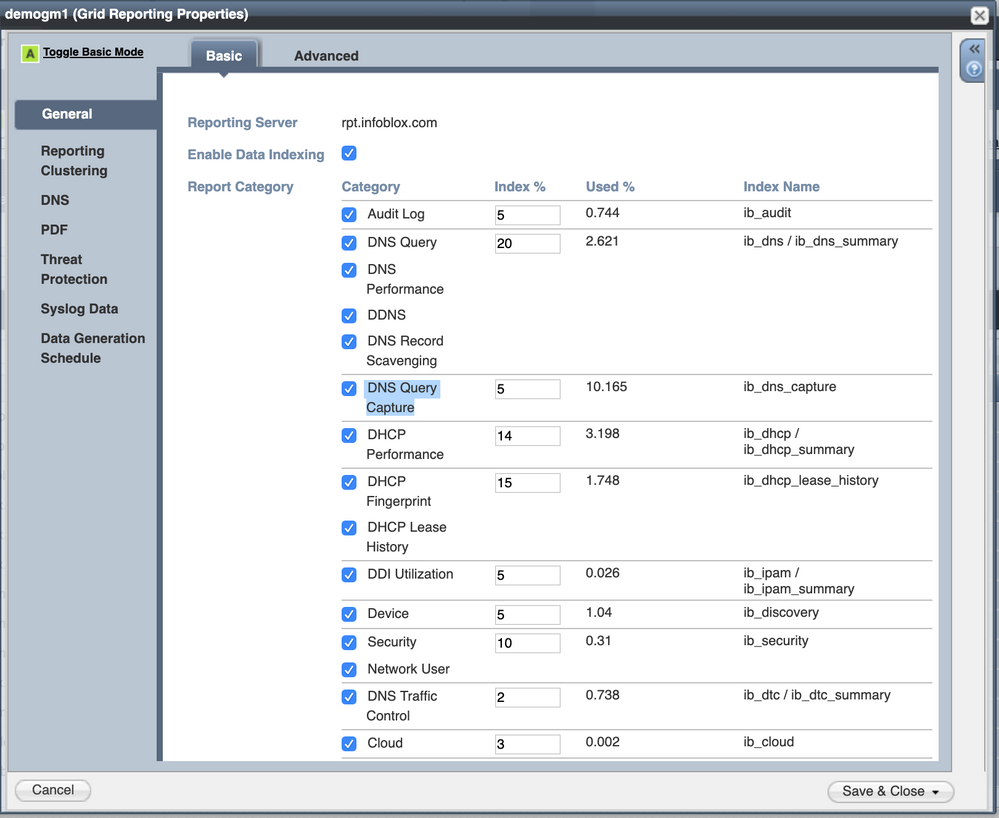
I am very familiar with the reporting appliance. What index aare you talking about? Without the syslog data you do not get that data. We are a very large enterprise and when we tried tuning it down it did not work. I need to go onto my lab notes and give some specifics. It comes down to this. The respones and queries are in the info priority which has the most traffic of all the priorities. That makes since since it is only information. We tried using the percentages on the Reporting Appliance settings but I do not think they work as advertised. We tried a bunch of different settings and none worked.
Re: DNS Latency Dashboard
- Mark as New
- Bookmark
- Subscribe
- Subscribe to RSS Feed
- Permalink
- Report Inappropriate Content
05-03-2019 12:53 PM
Take a look at this post for getting just what you really need out of syslog. Infoblox's filters are not nearly granular enough to be able to manage the syslog events well.
https://community.infoblox.com/t5/Reporting/Parsing-Syslog-Before-Sending-to-Reporter/m-p/11317#M503
That is complex to setup the first time, but we have now been running it for years. Just the "uncatorgorized" syslogs are 30 gig a day on our grid. I need just a few hundred meg of those logs to get some specifc data on the grid. That process has let us stay well under the 20 gig limit on our reporter.
Re: DNS Latency Dashboard
[ Edited ]- Mark as New
- Bookmark
- Subscribe
- Subscribe to RSS Feed
- Permalink
- Report Inappropriate Content
05-03-2019 01:01 PM - edited 05-03-2019 02:16 PM
We had this same discussion years ago I remember you. The problem is that the Reporting and Appliance application that infoblox set up does not let you use the wonderful features of splunk where you can do that kind of granualarity pre-processing that you would need to do.
Re: DNS Latency Dashboard
- Mark as New
- Bookmark
- Subscribe
- Subscribe to RSS Feed
- Permalink
- Report Inappropriate Content
05-03-2019 02:45 PM
I am now curious to try this. What version NIOS and what version reporter? The problem is still a matter of volume. Limit query to 10 minutes or a 100 mb. I think I get a 100mbs in seconds. I really want to make the Reporting appliance show some value.
Re: DNS Latency Dashboard
- Mark as New
- Bookmark
- Subscribe
- Subscribe to RSS Feed
- Permalink
- Report Inappropriate Content
05-03-2019 02:58 PM
So how are you getting the captured traffic into the indexer? I see the settings, not saving it to local disk. I see an SCP transfer. I am clued out how you get the query capture to populate the indexes.
Re: DNS Latency Dashboard
[ Edited ]- Mark as New
- Bookmark
- Subscribe
- Subscribe to RSS Feed
- Permalink
- Report Inappropriate Content
05-03-2019 03:35 PM - edited 05-03-2019 03:37 PM
I think what you are referring to is using the "Infoblox Data Connector" to receive SCP uploads of captured query/response data from your DNS grid members, let Data Connector do the pre-processing and then the Splunk forwarder on the data connector forward that data to the Indexer.
You'll find the deployment guide and user guide for Data Connector under the "Tech Docs" section on the Infoblox Support Site
Best Regards,
Bibin Thomas
Re: DNS Latency Dashboard
- Mark as New
- Bookmark
- Subscribe
- Subscribe to RSS Feed
- Permalink
- Report Inappropriate Content
05-03-2019 03:45 PM
Thank you for your quick response. I will try to do this. I will read the docs. I will keep everyone posted on what happened.
Re: DNS Latency Dashboard
- Mark as New
- Bookmark
- Subscribe
- Subscribe to RSS Feed
- Permalink
- Report Inappropriate Content
05-03-2019 03:55 PM
By the way, index for this data is already pre-defined on the Indexer on latest NIOS versions and the index is ib_dns_capture. There are around 4-6 reports/dashboards that would give you stats from the new data, such as the "DNS Domains Queries by Client" report/dashboard.
Since this additional data contains queries/responses in standard syslog format, you could perhaps additionally look into using rex/erex/ifx to extract additional fields, if required.
Happy Spelunking - not a typo ![]()
Bibin Thomas
Re: DNS Latency Dashboard
- Mark as New
- Bookmark
- Subscribe
- Subscribe to RSS Feed
- Permalink
- Report Inappropriate Content
05-03-2019 03:57 PM
Before fun - I am downloading a bunch of manuals - time to RTM ![]()
Re: DNS Latency Dashboard
[ Edited ]- Mark as New
- Bookmark
- Subscribe
- Subscribe to RSS Feed
- Permalink
- Report Inappropriate Content
05-08-2019 09:37 AM - edited 05-08-2019 10:22 AM
@cnsieler wrote:
So how are you getting the captured traffic into the indexer? I see the settings, not saving it to local disk. I see an SCP transfer. I am clued out how you get the query capture to populate the indexes.
I"m not sure who you were replying to, but we do not push the query logs to the reporter. We created a "data collector" appliance long before that was an offering from Infoblox. On that Linux box I get all the dns log captures via SCP, parse and forward them on to various locations, one of the destinations is actually the Infoblox Data connector appliance which only forwards them on to the cloud as we could not replicate that functionality with our custom appliance.
We get close to the above functionality by using the SNMP values for recursive DNS queries, but it does not have the details that the full query logging provides with the above report. We do some alerting on the recursive DNS latency and the reporting tool, but to trouble shoot it currently, we just grep the flat files of the query logs.
Re: DNS Latency Dashboard
- Mark as New
- Bookmark
- Subscribe
- Subscribe to RSS Feed
- Permalink
- Report Inappropriate Content
05-08-2019 10:04 AM
That is very interesting. The fact that my lab is virtual appliancs gives me the opportunity that I did not have when I first started on this journey. Since I am just using Temp licenses and it is just a "lab" I am going to try the Data collector out. I have also set up some Linux servers in my lab. One of those is collecting syslogs. I did not even think to run those back through the reporter! If I have questions I know where to ask. Friday, Monday I downloaded and read all the documentation on the data collector. Today I plan to start trying to set it up in the lab. I will post here my lessons learned.
Re: DNS Latency Dashboard
- Mark as New
- Bookmark
- Subscribe
- Subscribe to RSS Feed
- Permalink
- Report Inappropriate Content
05-21-2019 04:37 PM
Prerequisite is to have both queries and response capture enabled.
#################################################
When I went to try the queries fromn the dash board I only had the query being captured.
I was able to set up the data connector and the reporter has a source type of ib;dns;capture. That seems right. The problem is that I now have 10,000 plus sources. All the captures are there as csv files. yikes. That is not something is desired. What did I set up wrong? I suspect it is because I foillowed the documentation and checked the block on retain captured queries/replies on the local disk. I just unchecked that block.
Re: DNS Latency Dashboard
- Mark as New
- Bookmark
- Subscribe
- Subscribe to RSS Feed
- Permalink
- Report Inappropriate Content
05-21-2019 04:42 PM
So How do I clean up the 10,000 csv files I created? /var/captuired-dns/captured-dns-mygridmembername-plus somenumbers.csv
Glad this is just a Lab!!!!!
Re: DNS Latency Dashboard
- Mark as New
- Bookmark
- Subscribe
- Subscribe to RSS Feed
- Permalink
- Report Inappropriate Content
09-17-2019 12:51 PM
Do I just need to paste that XML file in my "edit source" tab and complete those prerequisites?
